
BTC Dominance: An Analysis on the Inverse Relationship Between BTC Dominance and Alt-Coin Market Health
By: Patrick Conlin
This week in crypto opened with some of the most significant movement in market cap that we have witnessed in months, with an increase of over 20 billion in new capital. Global market cap went from around 112 billion on Sunday to where it stands currently today at over 135 billion. Other positive indicators are related to 24 hour volume which spiked earlier in the week at over 30 billion dollars, doubling the average daily volume we have been accustomed to over the many months of this bear market. Bitcoin which opened the week at around 3,600 broke 4,000 on Tuesday February 19,2019 for the first time in over a month, since January 9 of this year. Again, the positives here are in growth not retraction, its still uncertain whether or not current global cap represents a market floor. Given the inherent volatility associated with token speculation its dependent on consumer confidence in developed projects and a clear regulatory environment for both investors and entrepreneurs moving forward. Bitcoin dominance has reflected this as it has remained well above 50% since the crash of 2018. It is within this lens of BTC market dominance we will examine the health of alt-coins and possible indicators to the next bull run.
This week BTC dominance fell over 3 percentage points helping to propel gains in projects such as EOS, Waves, Ontology(ONT), Bitcoin Cash(BCH), Litecoin(LTC), Ethereum(ETH), and Binance coin(BNB). Throughout this bear market BTC dominance has been around 56%, as global cap has receded it can be expected that investment would favor the one crypto market constant and standard. However, in analyzing historical graphs of crypto over time there exists a seemingly inverse relationship between BTC dominance and alt-coin investment. BTC dominance remains high and stable over time relative to alt-coin movement, it makes a significant run rewarding investors, then profits are invested in to more high risk projects. Lets examine some historical snapshots, the first of which concerns alt-coins in the early market days of 2014.

In the above snapshot from 2014 we can focus on March 4 which is where alt-coins investment showed the largest gains relating to a decrease in BTC dominance. On March 2 BTC dominance was over 87% while other alt-coins were 6.61%. Two days later on the 4th dominance fell to 81% as alts grew to 13.54%. Here exists one of the first discernable examples of this inverse relationship.
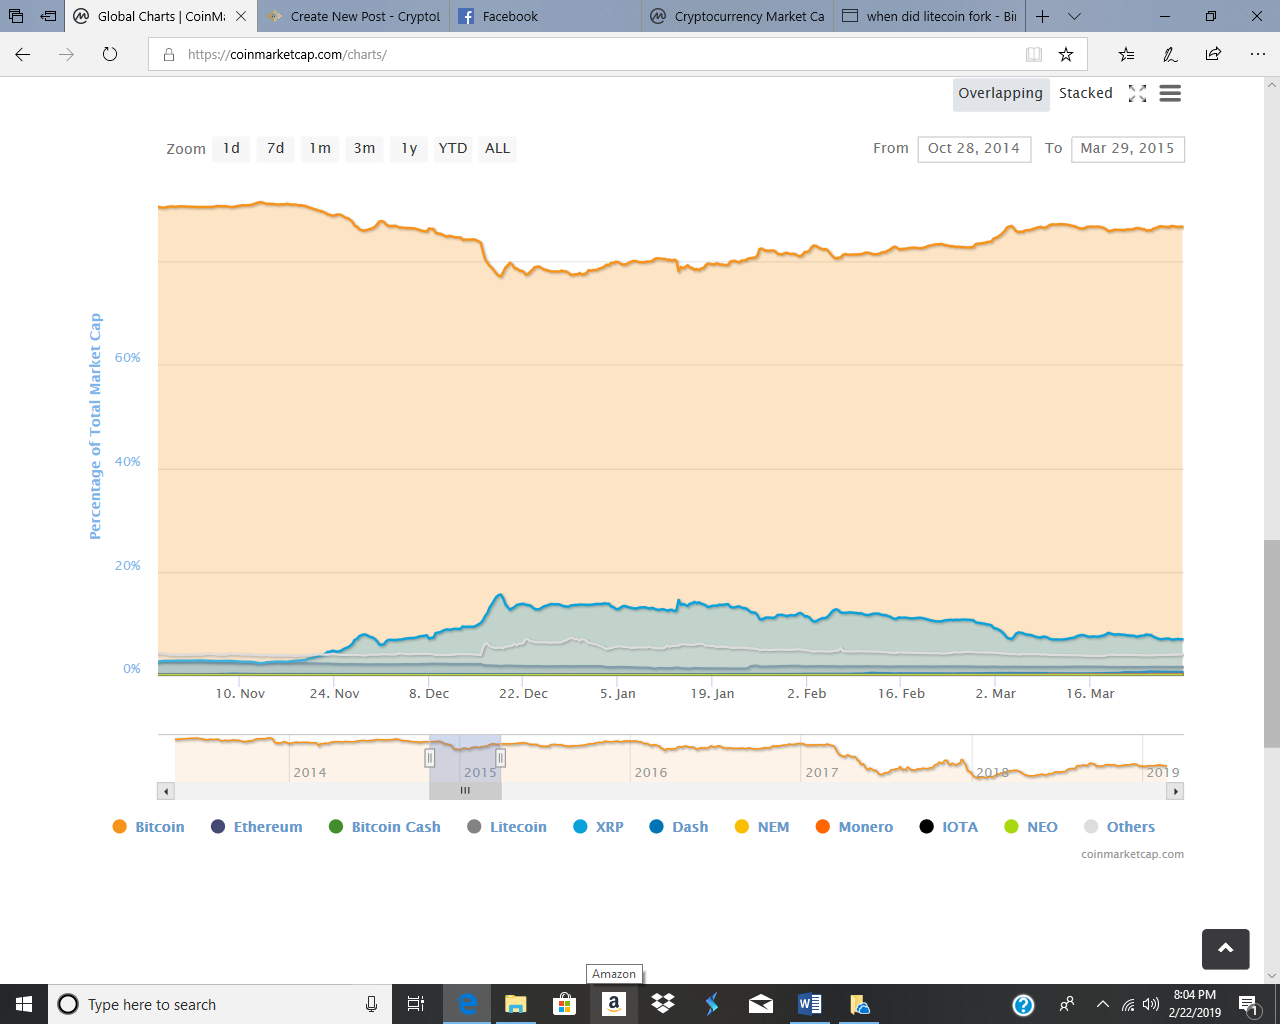
Fast forward some months to late 2014 and early 2015 and we can examine another similar trend in market activity. In this historical time shot we witness a huge run on XRP or Ripple. It happened to coincide with an op-ed by CTO Stefan Thomas in TechCrunch in September of 2014 and announcements regarding partnerships with the banking industry(https://ripple.com/insights/ripple-labs-2014-a-year-in-review/) On November 20, 2014 BTC dominance was at 90%, XRP 3.32% and all other alt-coins at 3.89%. Four weeks later BTC dominance declined to 77%, other alt-coins grew to 5.37%, while Ripple ballooned to 15.59% of overall market share.

Once again in the image above we witness a similar run on Ethereum as we did previously with XRP. On Thursday February 18, 2016 BTC dominance was 86%, while other alts were 3.56% and Ethereum was at 4.39% respectively. About 4 weeks later on March 13, 2016 BTC dominance fell to 74% while other alts grew to 6.86% and Ethereum climbed to 13.22% of market cap.
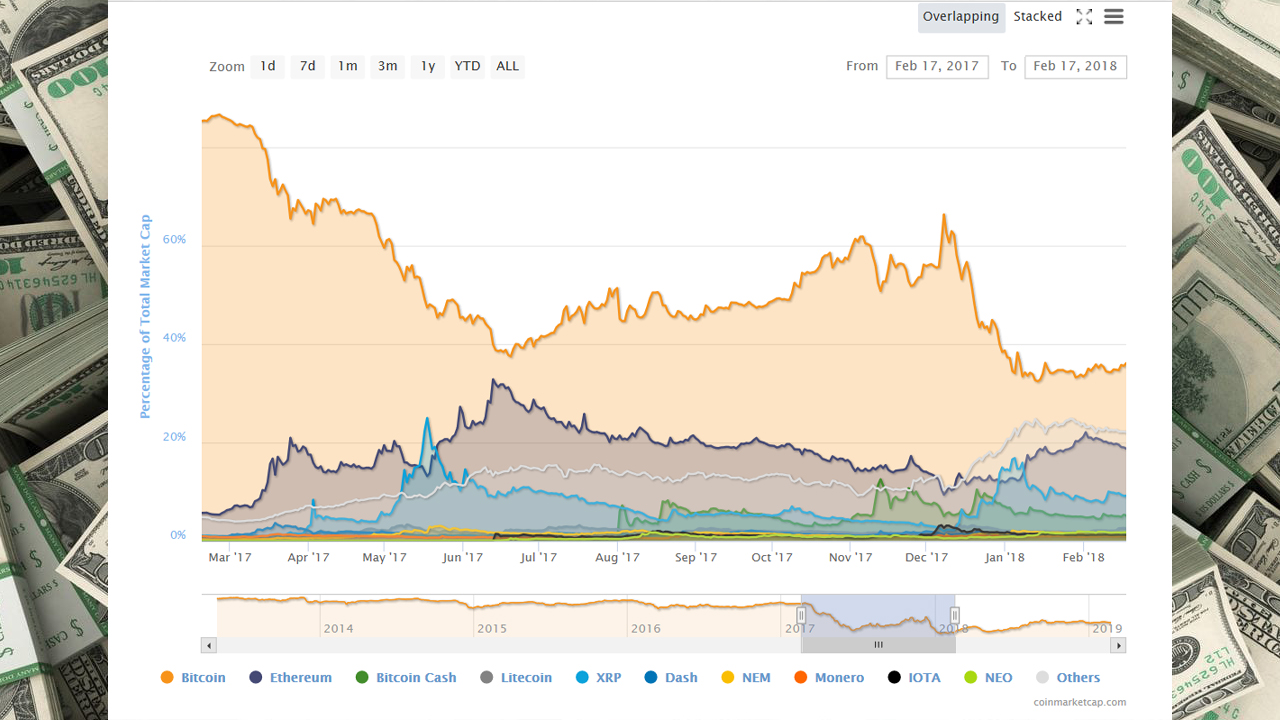
Now, we will examine the market run of 2017 that captivated a retail audience and drove speculation to unprecedented heights. An enthusiasm and occultism which caused Coinbase and Bittrex to crash, that pushed Bitcoin above 20,000, Ethereum over 1,300, investments in unknown ICO’s that existed only in proposed whitepapers, and the subsequent crash that has left us all on our knees hoping for the next recovery.

The above graph depicts the dates of one year from February 17, 2017 to February 17, of 2018. The frame is best described in two words, “Blow Out”. On February 17, 2017 global market cap was 19 Billion, at its height of January 7, 2018 global cap was $ 830.405 billion. In just under one year the market grew by 4,000%. These metrics best illustrate the inverse relationship between BTC dominance and alt-coin market health, as investors sold off gains in Bitcoin they invested into both established platforms such as Ethereum and Ripple as well as riskier ventures buying the hype and FOMO of the next new ICO. On March 1, 2017 BTC dominance stood at 85%, Ethereum 6.59%, with alt-coins at 4%. A month later on April 1, 2017 the run had begun as BTC fell to 67%, Ethereum climbed to 17.55%, XRP back to 3% and alts modestly to 7.16%. The summer market high peaked when, for the first time in history, BTC dominance dipped below 40% to 39.97, while Ether claimed 33% of market share, Ripple at 9%, with all other alts at 13.26% respectively. Over the next few months investors put their gains back into Bitcoin and as BTC dominance grew in market share so too did the alt-coins retrenchment. It must be stated that for most investors this is the overall point, that is to put money into projects that can yield a higher percentage over a given period of time than Bitcoin.
Bitcoin hit its all time high on December 17, 2017 breaking 20,000 USD per token. Despite this, BTC dominance continued to fall being 54% on that day, down from its high of that period of 66.40% on December 7, 2017. BTC yielding all time highs still could not outpace interest growth of alt-coins during the peak of the bull run in December of 2017 and into early January 2018. Look close at the grey indicator for alt-coins, this a result of the ICO craze. Now, one year later, more than half no longer exist. On December 7, 2017 alt-coins represented 10% of market share. On January 12, 2018 a little over a month later, Ethereum grew from 9% to 17%, BTC fell to 32.69%, and alt-coins ballooned to 24.77% almost a quarter of market cap or roughly 200 Billion dollars.

In the final graph we examine the crypto winter and the stagnation that BTC dominance reflects to overall market health. As BTC dominance has grown and remained above 50% other projects such as Ethereum, Ripple, Neo, and alt-coins have suffered. This is also related directly to global market cap, as investors worrisome of volatility in the crypto space want to secure their money in ecosystems that reflect the potential for stored value. This may be another reason why we have witnessed the launch of so many new stable coins, as it was only a few weeks ago that three were trading in the top 25 of daily volume on CoinMarketCap, Tether is currently listed 7th at more than 6 billion in daily volume. Back in May of 2018, the last noticeable run for alt-coins, BTC dominance fell to the mid to high 30’s while alts climbed back near 25% before retreating. This we believe to be the indicators of a sufficient bull run, that is BTC dominance falling below a 40% threshold.